EECS 298: Social Consequences of Computing
Lab 12
Task
In this lab, you will be following the instructions given in a jupyter notebook file to create a certain graph in matplotlib. We will be exploring the idea of universal design, particularly in accessibility in reading graph outputs. You will start with a graph and modify two features to make the graph more visually accessible to those wtih vision impairments while making the graph clearer for others along the way.
lab12.ipynb
Download the jupyter notebook file and the dataset you will use with wget:
wget https://raw.githubusercontent.com/eecs298/eecs298.github.io/main/files/dataset-lab11.csv
wget https://raw.githubusercontent.com/eecs298/eecs298.github.io/main/labs/lab11.ipynb
Recall that you can open a jupyter file (.ipynb) in VS Code and install a jupyter extenision if necessary to run the code. Follow the rest of the instructions for the lab in this jupyter notebook file and turn in your final graph to Gradescope when you’re done.
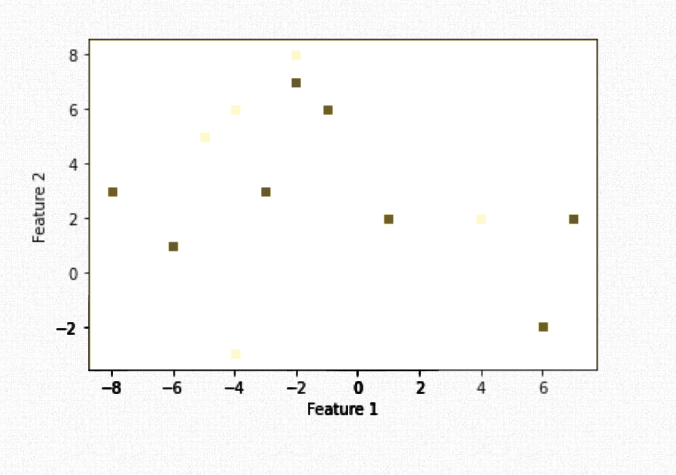
Just in case if you can’t see the graph in the jupyter notebook file, here is the graph:
Thank you everyone for a great semester :)!